
Putting AutoTools pie chart to a good use – SSID logger
For a long time, Tasker GUI options were very limited. All we had to display options and values were the deeply flawed scenes. This is changing lately, as João introduces more and more options to the AutoTools. One of the latest addition is AutoTools pie chart – one of the downloadable presets for the web screens. I put up a simple tutorial that is a little bit more useful than the top football scorers (sorry João).
AutoTools pie chart
Everyone like a good pie (or a pie chart) and AutoTools pie chart make it super easy to create one. All you need is a single action. That’s all fair but we have to deliver the data to the chart first. My idea is to create a pie chart of all SSID connected, by the time spent connected to each one of them. I’m going to talk a lot about variables, and if you want to learn more I have a good video about it.
To draw AutoTools pie chart I will need 2 pieces of data:
- NAMES – the SSID names in an array
- NUMBERS – the time values also stored in an array
Tasker makes it easy to extract both the SSID name and calculating the timings based on the built-in variables %WIFII and %TIMES, but I need some data manipulation to keep adding the times and new SSIDs to my table. The graph will automatically add the new SSID and update the timings accordingly.
[tabs tab1=”TASKER TASK: Draw Graph” ] [tab id=1]Draw Graph
A1: AutoTools Web Screen [ Configuration:Screen Preset: Pie Chart
Display Mode: Dialog
Source: /storage/emulated/0/AutoTools/pie_chart/page.html
Toast Duration: 5000
Background Color: #FFFFFFFF
Height: 400
Gravity: Center
Animation: Slide In From Top
Show Duration: 500
Hide Duration: 250
Text: WiFi connected times
Names: %GraphWifi()
Numbers: %GraphTiming()
Is 3D: true Timeout (Seconds):30 ]
[/tab][/tabs]
Let’s create the AutoTools pie chart first. Download the AutoTools Web screen preset and add it as an action. The most important config items are NAMES and NUMBERS. I will create an array for each value: %GraphWifi() and %GrapTiming().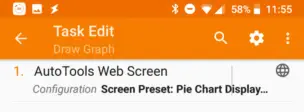
Graph Create Arrays
	A1: Array Set [ Variable Array:%GraphWifi Values:0 Splitter: ]
	A2: Array Set [ Variable Array:%GraphTiming Values:0 Splitter: ]
[/tab][/tabs]
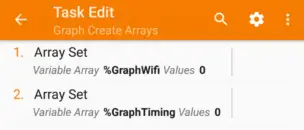 To make the arrays ready to be used, I created another task where I simply create the arrays with 0 as values. Once created, open the Vars tab and delete the %GraphWifi(1) and %GrapTiming(1) entries. I need bare arrays.
AutoTools pie chart – data processing
 The idea is to push a new SSID (or update an existing one) to the %GraphWifi() and calculate the time and push it to the same index in %GrapTiming(). It’s easier said than done, but let’s take a closer look.
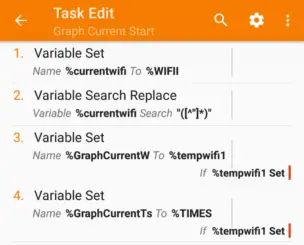
Graph Current Start
	A1: Variable Set [ Name:%currentwifi To:%WIFII
		Recurse Variables:Off Do Maths:Off Append:Off ]
	A2: Variable Search Replace [ Variable:%currentwifi Search:"([^"]*)" Ignore Case:Off
		Multi-Line:On One Match Only:Off
		Store Matches In:%tempwifi Replace Matches:Off Replace With: ]
	A3: Variable Set [ Name:%GraphCurrentW To:%tempwifi1
		Recurse Variables:Off Do Maths:Off Append:Off ]
		If [ %tempwifi1 Set ]
	A4: Variable Set [ Name:%GraphCurrentTs To:%TIMES
		Recurse Variables:Off Do Maths:Off Append:Off ]
		If [ %tempwifi1 Set ]
[/tab][/tabs]
To calculate the time, I need a timestamp from when the WiFi had been connected until the disconnection time. %GraphCurrentTs (TimeStart) will capture the %TIMES and sets the number of seconds connected at the end:
%GraphCurrentTe = %TIMES - %GraphCurrentTs
That was easy enough.
SSIDs need a little bit of work, first I have to extract the SSID name using the Search/Replace action and the regex pattern:
"([^"]*)"
This should cover most of SSID names. I’m storing this value in %tempwifi1 (note that the result of the search is an array!) That value is assigned later to %GraphCurrentW. To assure smooth operation, I only push the values if the %tempwifi1 is set.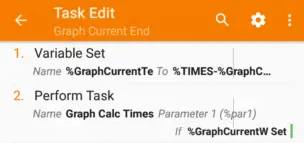
Graph Current End
	A1: Variable Set [ Name:%GraphCurrentTe To:%TIMES-%GraphCurrentTs
	    Recurse Variables:Off Do Maths:On Append:Off ]
	A2: Perform Task [ Name:Graph Calc Times Priority:%priority
	    Parameter 1 (%par1):%GraphCurrentW
	    Parameter 2 (%par2):%GraphCurrentTe
	    Return Value Variable: Stop:Off ]
	    If [ %GraphCurrentW Set ]
[/tab][/tabs]
When the WiFi is disconnected, I calculate the end time (%GraphCurrentTe) and pass both values (SSID and time in seconds) as %par1 and %par2 via Perform Task action.
These two have you be linked to a State Condition: WiFi Connected as an entry and exit tasks.
AutoTools pie chart – Array manipulation
 [tabs tab1=”TASKER TASK: Graph Calc Times” ]
[tab id=1]
[tabs tab1=”TASKER TASK: Graph Calc Times” ]
[tab id=1]
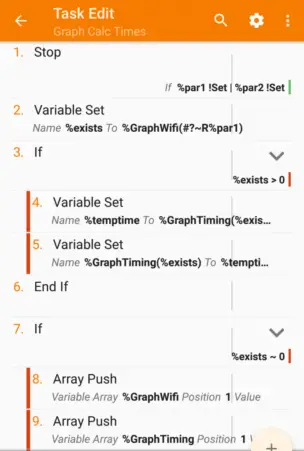
Graph Calc Times
	A1: Stop [ With Error:Off Task: ]
		If [ %par1 !Set | %par2 !Set ]
	A2: Variable Set [ Name:%exists To:%GraphWifi(#?~R%par1)
		Recurse Variables:Off Do Maths:Off Append:Off ]
	A3: If [ %exists > 0 ]
	A4: Variable Set [ Name:%temptime To:%GraphTiming(%exists)+%par2
		Recurse Variables:Off Do Maths:On Append:Off ]
	A5: Variable Set [ Name:%GraphTiming(%exists) To:%temptime
		Recurse Variables:Off Do Maths:On Append:Off ]
	A6: End If

	A7: If [ %exists ~ 0 ]
	A8: Array Push [ Variable Array:%GraphWifi Position:1
		Value:%par1 Fill Spaces:Off ]
	A9: Array Push [ Variable Array:%GraphTiming Position:1
		Value:%par2 Fill Spaces:Off ]
	A10: End If
[/tab][/tabs]
Before processing anything, I want to make sure that both values are set correctly. A stop action is performed if either of the %par isn’t set.
A clever search through my array:
%GraphWifi(#?~R%par1)
using variable set %exists checks if the given SSID is already stored in %GraphWifi().
Now we have two options:
%exists > 0
The array contains the SSID name already, the %exists value equals to the index value of where the SSID is stored. In this case, I only need to update the time. To do so I’m extracting the value from that index, and adding additional seconds using “do math”
%temptime = %GraphTiming(%exists)+%par2
and then adding the final value back to where it was taken from.
%exists = 0
The SSID is not in my array, and I need to push the SSID name and the time value. The array push action is great as we can always push both values to the 1st position, shifting anything else up:
ArrayPush position 1
%par1 -> %GraphWifi()
%par2 -> %GraphTiming()
With updated arrays, we can call in our AutoTools pie chart whichever we want. I’m lazy and for the demonstration purposes, I just added the home screen shortcut.
Conclusion
The AutoTools pie chart tutorial introduces a little more than just pie charts. You can learn how to update array values and how to search if new entries need to be added. This is a super useful skill to have when processing connected data in Tasker. If you rather download ready-made files – you can access it here. [Patreon Supporters have the exclusive 3 day early access before link becomes public]