
Tasker and internet pie charts
Previously, I played with AutoTools pie charts and I created an SSID logger. A pie chart that shows you which WiFi you are connected to most. It’s working neatly, and you can read more about it here. It uses AutoTools web screens, a name which can be slightly misleading as these screens are not available on the web. It’s time to fix it and mirror that information to my NodeRED server. I’m going to display the same information as a NodeRED pie chart.
NodeRED pie chart
 You will need the Tasker project to get the information about the SSIDs. If you just want to learn how to feed data to pie charts you can skip that part. To display the NodeRED pie char I’m going to use NodeRED dashboard:
sudo npm install node-red-dashboard
To feed the pie chart correctly, I need two pieces of information:
- msg.topic (data type)
- msg.payload (value)
To receive data from tasker, I’m using HTTP request node. It’s the easiest way of submitting the information as I can pass the data in JSON format. Something that makes the data handling much easier.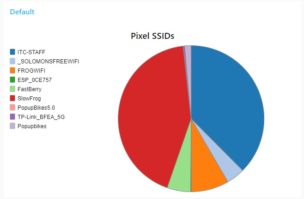
Each data set is submitted as:
msg : Object
payload: object
    ssid: "FastBerry"
    time: "1304"
This way I can easily assign the payload and topic using a function node:
var time = msg.payload.time;
var ssid = msg.payload.ssid;

msg.topic = ssid;
msg.payload = time;
return msg;
Once payload and topic have been formatted correctly, I can submit the message object to the pie chart node.
Feeding NodeRED pie chart from Tasker
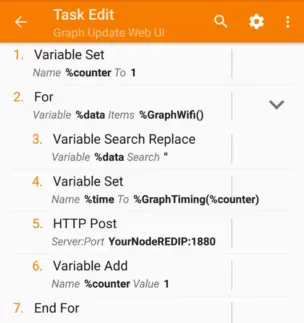
Graph Update Web UI
	A1: Variable Set [ Name:%counter To:1
	    Recurse Variables:Off Do Maths:Off Append:Off ]
	A2: For [ Variable:%data Items:%GraphWifi() ]
	A3: Variable Search Replace [ Variable:%data Search:"
	    Ignore Case:Off Multi-Line:Off One Match Only:Off
	    Store Matches In: Replace Matches:On Replace With: ]
	A4: Variable Set [ Name:%time To:%GraphTiming(%counter)
	    Recurse Variables:Off Do Maths:Off Append:Off ]
	A5: HTTP Post [ Server:Port:NODEREDIP:1880
		Path:/ssidpie
		Data / File:ssid=%data
			    time=%time
		Cookies: User Agent: Timeout:10
		Content Type:application/x-www-form-urlencoded
		Output File: Trust Any Certificate:On ]
	A6: Variable Add [ Name:%counter Value:1 Wrap Around:0 ]
	A7: End For
[/tab] [/tabs]
To send the information to NodeRED pie chart there are few things we have to take care of. First I’m going to set a %counter to 1 which I’m going to increment by 1 in a loop.
In the FOR loop, I want to strip the ” ” from the SSID names as they will interfere with the JSON structure later. The value is then paired with the %time and processed via HTTP POST as a pair of:
Path:/ssidpie
Data / File:
ssid=%data
time=%time
Each SSID time and name will be sent as a single web request. You could create an array at this point and send it all at once, but there won’t be many of entries here and it’s easier to assign that information in the NodeRED.
Conclusion
As you can see – this is fairly simple. You can post any data this way from Tasker to NodeRED and display it as a graph or a pie chart. NodeRED pie charts can be very useful, and unlike the AutoTools counterparts, are accessible through a web browser. You can download the ready-made files from this link (note that Patreon supporters get access 3 day early to all files)